

Introduction
Application logging is a critical part of log management and can help keep businesses running smoothly. If you don’t have any proper logging records, it is difficult to identify the events, and it will also consume a lot of time in troubleshooting. That’s why application logging is essential for optimising, monitoring, and troubleshooting your integration solutions. And due to the limitations of the cloud hub, it is difficult to track or monitor the logs after a certain period.
To overcome this, organisations must opt for log aggregation tools. To simplify this process, we have designed a service to publish the logs generated by the Mule application to log aggregators like ELK and Splunk.
What is the Log Aggregation Service?
The log aggregation service was designed to publish the logs generated by the Mule application to log aggregators like ELK and Splunk.
- It is a rest-based service that listens to and publishes the logs to ELK or Splunk.
- Supports different formats to publish the logs.
- Publish the logs based on indexing.
Log Aggregation Utility
Setting up Splunk
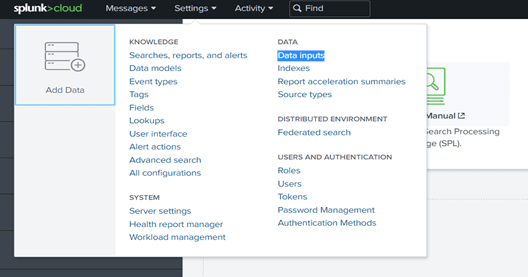
1. Once you have configured your Splunk, the first step is to create the data inputs. Splunk supports different data inputs. Navigate to Settings -> Data/Data Inputs and configure the data input you want.
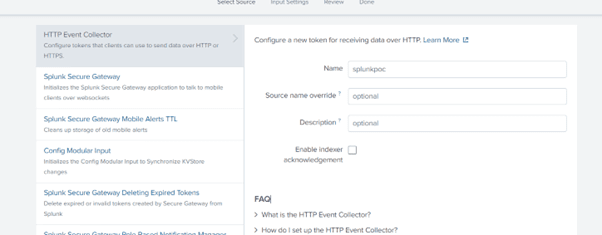
2. Create a new HTTP Event Collector by providing the below details.
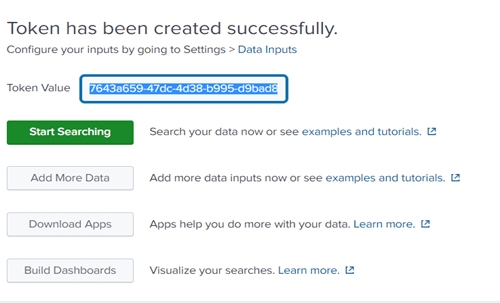
3. A token will be generated for HTTP Event Collector, and you need to use this token to publish the logs to Splunk.
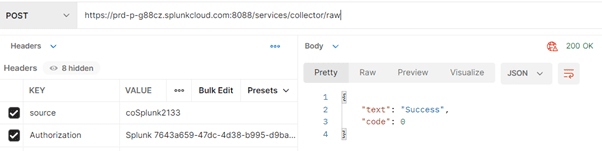
4. Using the generated token, you can publish the logs to Splunk by configuring endpoint details like below.
- You need to services/collector/raw or services/collector/event in order to create an entry in the Splunk.
- And configure the source details; it acts as an index in Splunk.
Log Aggregation Utility Service
1. Once you have setup your Splunk configuration, you need to configure the below properties in the log aggregation service.

2. Configure the http request endpoint details of the log aggregation service, publish the logs of your application, and configure the source in the query parameters.
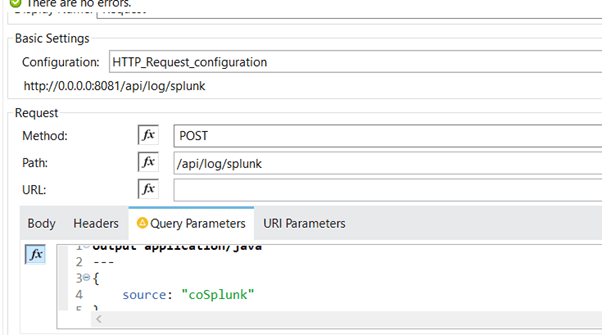
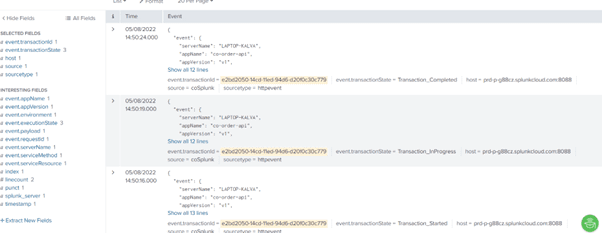
3. Once the call is generated, the log aggregation service will publish the logs to Splunk, and the same can be viewed on the Splunk dashboard.
Configure a Splunk HTTP Event Collector (HEC) token, then add an asynchronous SplunkHttp appender to your Mule app’s log4j2.xml on CloudHub 2.0. This streams application and runtime logs directly to Splunk without a custom relay service. For trace and audit data, pair it with Anypoint Monitoring’s Telemetry Exporter.
No. Anypoint Studio does not include a dedicated Splunk connector. MuleSoft instead documents two supported native integration paths: the asynchronous Log4j SplunkHttp appender for application and runtime logs on CloudHub 2.0, and the Anypoint Monitoring Telemetry Exporter for trace and audit data sent to Splunk HEC.
No, not for the core use case of getting logs into Splunk. A custom REST forwarder made sense before CloudHub 2.0 documented a native Log4j appender path, but most teams today can replace that forwarder with the SplunkHttp appender and, where trace-level detail matters, the Telemetry Exporter.
The Log4j SplunkHttp appender streams individual application and runtime log lines to Splunk as they’re written. The Telemetry Exporter, built on the OpenTelemetry standard, exports distributed traces and audit log events from Anypoint Monitoring instead. Production observability setups on MuleSoft typically run both side by side.
MuleSoft documents the Log4j-to-Splunk appender and the Telemetry Exporter for CloudHub 2.0 and Runtime Fabric, not CloudHub 1.0. Organisations still running CloudHub 1.0 should plan their CloudHub 2.0 migration alongside any Splunk logging redesign, since that migration unlocks official support for both mechanisms.